Statistics
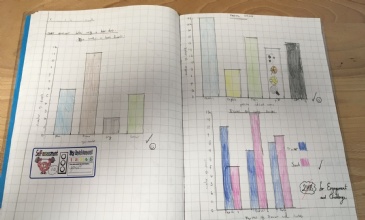
This week in maths, we were looking at interpreting data presented in different formats...
The children have looked at a range of different pictograms, some with keys, as well as bar charts and tables. From these, we have answered single and two-step problems. In addition, we created our own bar charts as you can see from the image.