Maths
We have been collecting data in different ways.
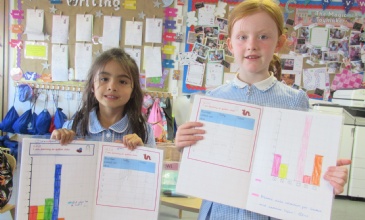
In Maths this week we have been developing our data collection and statistic skills. We collected different sets of data and we started simple by grouping cubes into colours and putting them into a bar chart to see which one we had the most of. This was a great introduction into their format. We also collected date around our school such as children’s birthdays and how many cars went past the school. After this we learnt how to represent our data using tally charts, pictograms and bar charts. As well as being able to interpret what they mean. This was a great skill that we can’t wait to continue to develop next year.